12.12.2016 ― Time series of a Triptych
Snapshots: static data from painting process
Background
As much as art should be maybe a thing driven by the spirit within, sometimes a sponsor helps to trigger that too. Happened one day that there was a patronage who enabled a painting project. The order was for a set of few tables, thus it started to sound like databases already at the very beginning. Think if painting canvas is a table, a tube is a data source, paint is data, and brushes are interfaces. Data is delivered from the sources to the canvas. As data in the table is alive, it changes while the process is running. At that time new paint is applied on the canvas from different tubes; some areas might be getting even multiple paint layers on them.
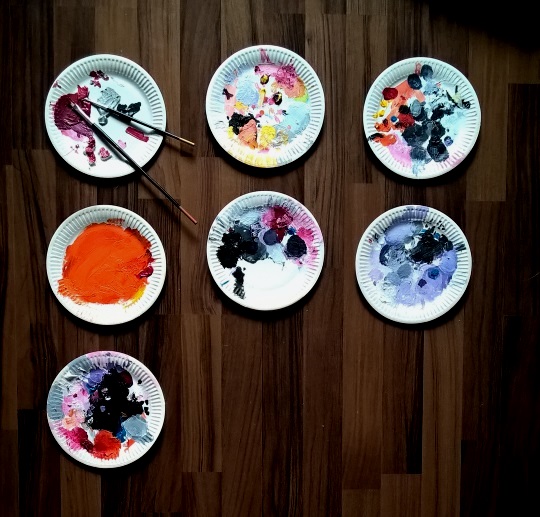
If a painting is modifying all the time, how to save a static moment of the painting process? For example using same method as to back-up databases: taking snapshots. A snapshot provides a static view to the database at a specific time moment. In painting case, a snapshot could be a photo of unfinished paintings. Then again, holding camera in identical place during a year is bit troublesome. Why not taking the advantage of authentic staging table snapshots instead? The palettes. As painter first mixed her paints and colors on a flat surface called palette, this item is actually a middle phase between tubes and the canvas. A temporal storage place, before loading paint into the target.
Using only one palette would not end up well. All data of paint would exists on the palette, but only the top layer of paints would be visible for a viewer. If using multiple palettes – here cardboard plates – the painting process can be saved from multiple execution phases. And studied side-by-side afterwards. One palette is an observation; multiple will create a series. Thus, palette gathering will create also a time series of the paintings.
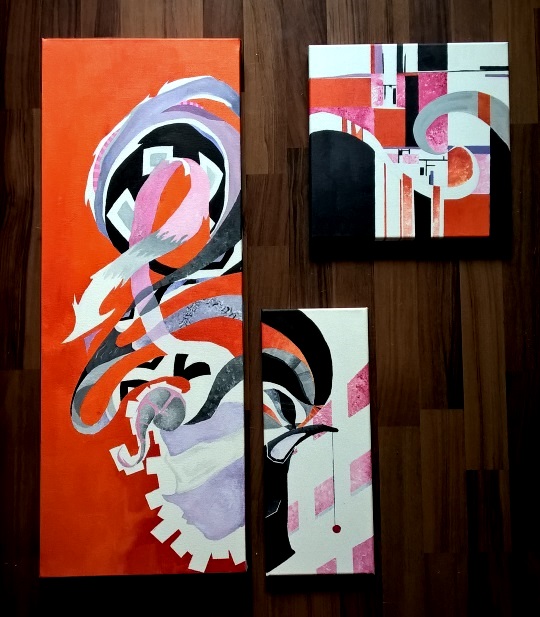
So time passed, paints and brushes flew through the air and the floor. In the end it did take a year to finish the paintings. Not that it would be exhausting by the amount of work, but times the inspiration was just bit absent. For long a time. And when it finally appeared, the project would progress with the speed of light. Yet there is a rather long learning curve. Any execution is not just a result of a moment, but rather born from thoughts and trials of entire life-time [1]. Just like chronic migraine, poor posture or nirvana. Hopefully, not all of them in the same time.
Processing
Processing [2] is an open-source sketchbook software, build on Java language. Many things make it really flexible tool for data visualization and data art usage, but one of best features is the user interactions one can embed into executions. For example using different mouse elements as interactive gestures. Whereas static images can contain a lot of information from data, interaction abilities can enable a user to research the result much better. For example, to focus on certain subset of data or result.
Having the palette time series of three paintings, the way a user could track the painting progress is to recognize the color shades from the data and the result. In such way the user can follow the colors of each palette and try to trace the execution order of the paintings. The thing to build now is a window with images, control the mouse locations, process a pixel point under the mouse and modify the images by the selected color hue.
Execution
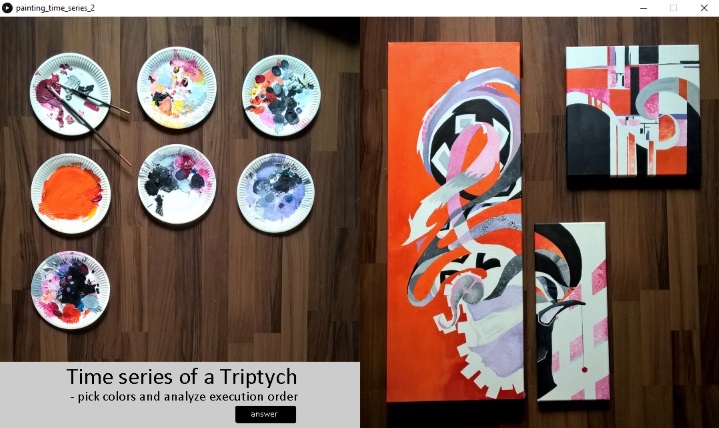
A Processing made java execution shall follow. On the left side of the applet window, one will see the data, palettes in sorted order. On right side, there is the final table set execution. On authentic version (!= website image version) the viewer could juxtapose the data and the results by clicking the mouse over colors. First click will retain in the images only the pointed color hue value ± small interval to the selection. Second click will release the hue selection, and the window will present the original images again. By selecting several color hues, either from palettes or paintings, an analyze may be done using multiple iterations.
UIs are cool as long as a user feels one is having the control. If one ends as to be a part of a machine, unable to do any real actions or choices, the execution is a simulator. And such thing would be totally party pooper, let's avoid it. Thus a decision was made to avoid any unnecessary buttons and sliders, as they restrict the playing area only to pre-defined places. Only one button was created to reveal the actual execution order from both sides. As in reality the paintings were created from bottom-up, painting one table at time from scratch to complete.
Example image below, base view for the Processing execution.
Result with shade of pink as selected hue.
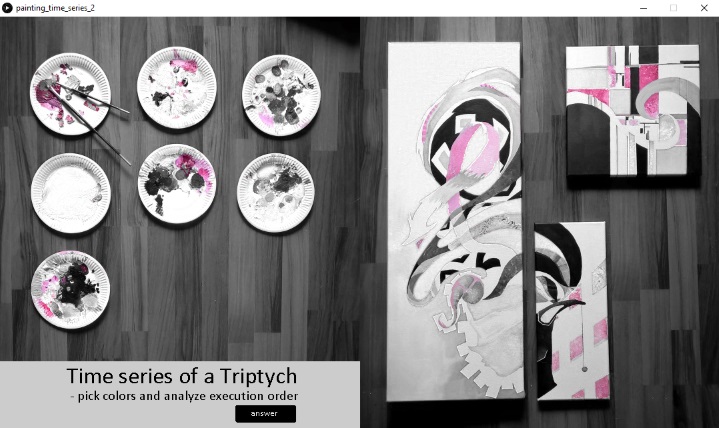
Result with shade of purple as selected hue.
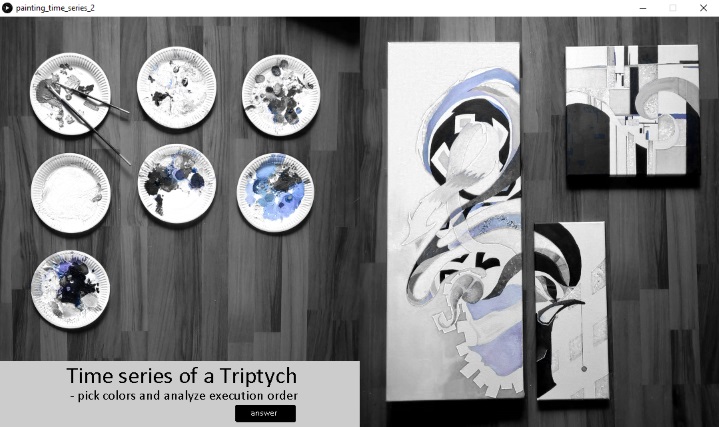
Image below, result of rust shade and answer button activated.
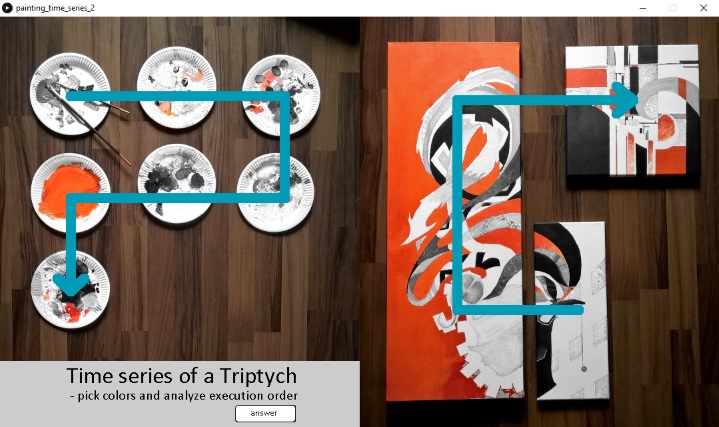
Any results to be learned? At least main color hues it does reveal in this case. Some sort of color progress might be having similarities with bottom-up painting path. The bigger the areas are painted with same shade, the bigger the stains are on plates. Such as vomit-rust plate demonstrates.
If one is looking details, an outlier might be also found. The first palette should not have existed. When one starts a painting project, open old tubes and uses faltering brushes the work is doomed. In those times a user might just abandon the trial, let too sticky paints and broken brushes dry together, and instead walk into nearest paint shop for peer support. After shopping therapy the second attempt with a palette, is another story and the real first snapshot. Even that one too might contain shades that were repainted later...
As paintings contained also shades of white and black, the hue-only approach might be bit naïve way to track the actual execution order. Hmm, putting such java applets to your website is bit old school these days (same goes also for actually having a website?), the source code added to GitHub.
End result
Time is relative.
Need paintings?
If you'll not forget your order in a year, ask me.
∎