20.11.2016 ― Windy movember
Trying to simulate moustache flow
Background
Feeling easily epileptic? You might want to close this website as you'll find couple of gif-animations.
If not and you would use Pokémon Shock [1] as screen saver anyway, you may proceed. This post honors those moving pixel images you can't stop, as there are no control buttons displayed. On the other hand, in any elevator there do are buttons – but sadly they only operate the machine, not the passengers. Therefore one is unable to stop the re-occurring thing while stuck in the between the floors: the legendary weather talk with strangers.
It is the thing that can combine strangers together, talking about misty mornings as if in post-apocalyptic world order. Or competing who had the lowest temperature measurement under their window. If you try to lie your weather data you'll be most likely caught. Everyone is actually a local weather expert and can figure it out if your values exceeds the confidence interval limits of current weather status. Luckily nowadays there is no need to invent any phony weather results as they are easily collected via APIs...
Observations
The Finnish Meteorological Institute has open data API for weather and warning datasets [2]. Such APIs are crafted for other people to use it, I'll take my advantage on the weather and try to map animations with it. As animations seemed to be quite popular topic in R spheres lately, been seeing several posts about it during the fall, so it might be worth to try.
First time I noticed, but pch parameter has actually more options than just basic values 0:25 [3]. There are actually lots of possible values, from Greek letters to math symbols. And also the suits from the French playing cards (?!). As hearts is one suit here, it can be turned as symbol. While used with other three suits (= diamonds, spades and clubs) hearts could represent any of nominal and equally relative categories. But when it's lonesome, without its default companions, it is symbol for affection. Therefore, what could be a thing to adore within the weather? Dunno, maybe wind and its magic: legends claim it can deliver red sand from Sahara to Alps. [4]
To enable the extended character symbols in R, one needs to insert f. ex. a parameter font=5 into the points() function. Then it's up to you to choose the right pch value according to the project.
Executions
This is stereotypical silhouette of Finland, drawn with R. It is static, shows no special information – nothing but the formation of the country and its borders. This shall be the base material for following animations.
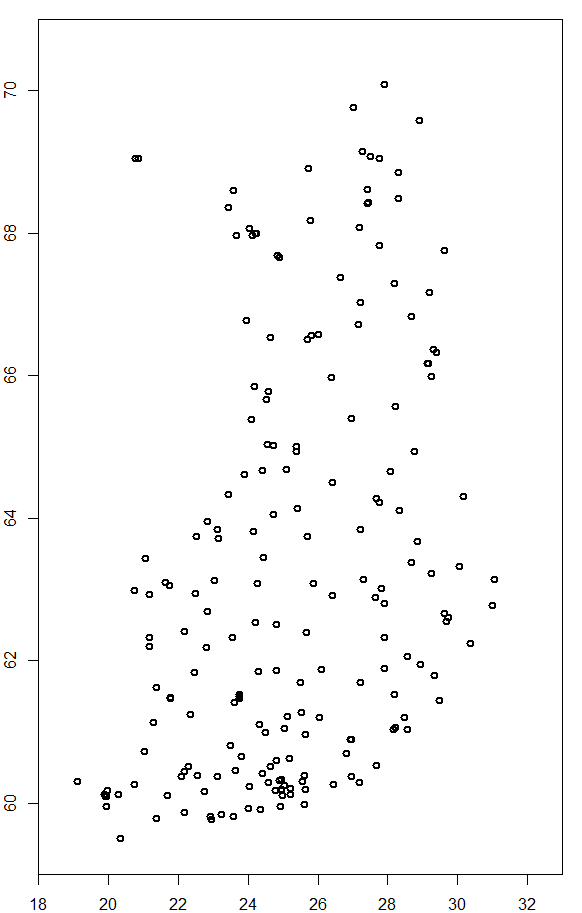
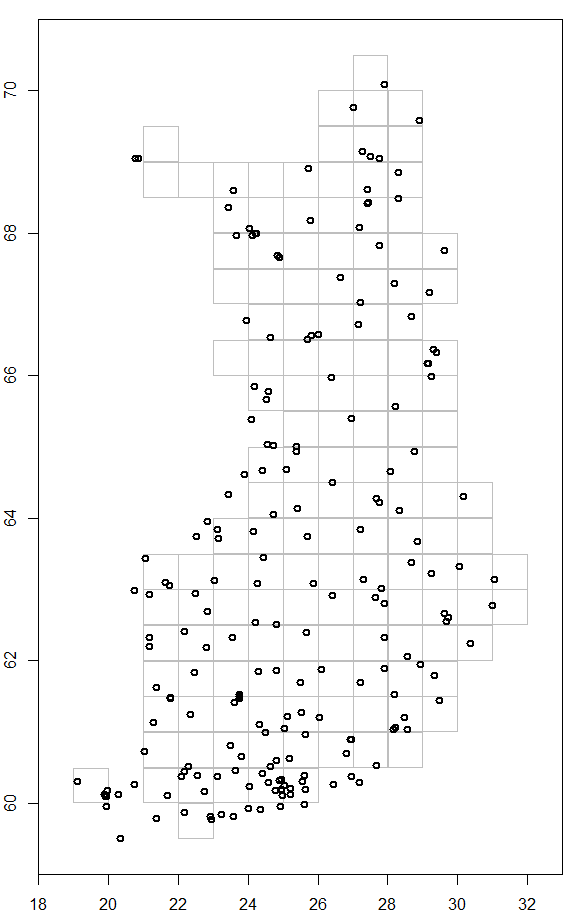
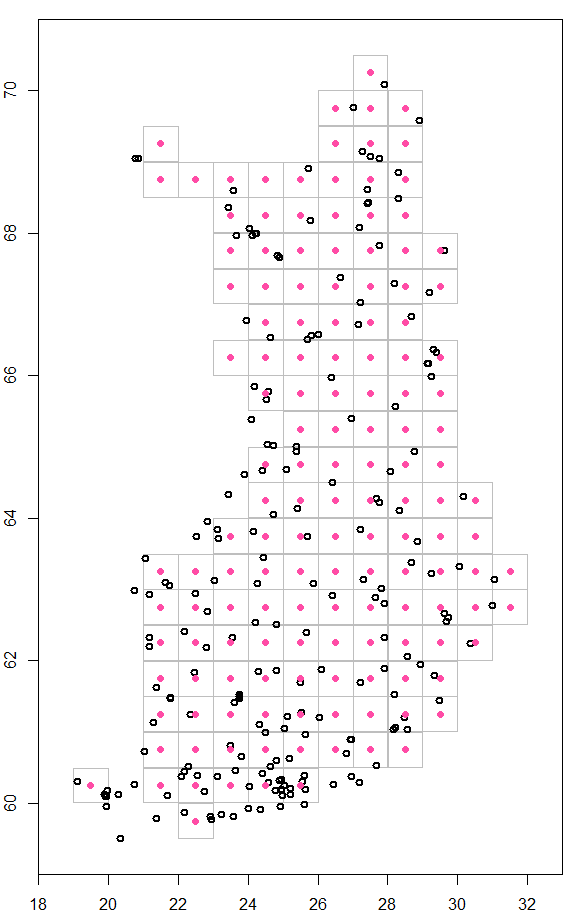
For execution one needs data, thus selecting sample data from weather API should be executed with named time interval. The measurements are recorded on each weather stations, which are not located on symmetrical grid. To solve this, I created a theoretical and symmetrical grid over Finland, based on longitude and latitude lines. Then according to each center point of theoretical grid square the nearest weather station was assigned to be the data source. The measurement was delivered from the named station. Thus, the squares represent theoretically the whole shape of Finland, even their measurement points may differ geographically a bit. The execution steps are illustrated below.
To add animation as feature, each image (based on individual time step) was saved from R and in collaboration with Image Magic [5] converted into GIF animation. The API was able to produce data points by 10 minutes interval, which was short enough to make single frames transfers smoothly and display data movement. As practice showed, not all weather stations were working or measuring all the time. Or there was a reasonable-sized birdie sitting on the measuring censor. There were several points that showed NA value all the time. To solve this data shortage, one could have started to fetch the second closest measurement point, third, or fourth...But then one might be already quite far from the starting point. Here the solution is to represent missing values as missing spots.
To test the system, first version was to show the affection towards wind – so bring the hearts! That is, to show where the strongest wind was existing during day time, 1st of October. The size of each heart is relative to the wind speed: the more the merrier. The western coast side and hilly parts of north seem to have rather high wind existence. As time changes, the situation slightly evolves.
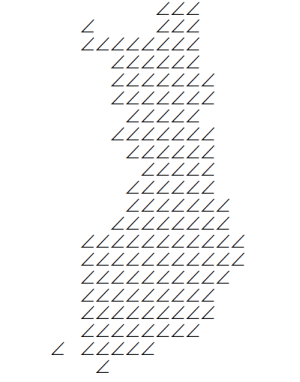
As the heart version was quite jolly set up, it did only present the speed of wind. To add direction information to image frames one approach was to make triangle tips to point directions. The speed would be now scaled as line width and color hue. Here joint movements are easier to distinct, and overall wind status is more visible. It looks as swaying wheat field in the wind.
And of course, since it is the unofficial month of moustaches, a movember edition was needed. Imaging yourself as a movember participant, having growing your precious upper lip accessories for weeks. Taking a selfie as a proof of your commitment is needed due picture-or-it-did-not-happen theory is currently ruling. So how is this all related to weather data?
Gathering sample data from November and transferring it to R-made emojis equipped with reddish moustaches created an alternative wind map. A set of emojis and wind blowing their long moustaches to the direction of air flow. The thickness of each moustache is relative to wind speed: the thicker, the better it protects one from the wind power. As some measurement points were lacking results (and I did not search for alternative measurement point options) there are sleepy idle emojis on the map. The API owner would prolly reward this idea with a proper facepalm.
Well, I have to say that the moustaches don't look as authentic I was aiming. For an unknown reason some concepts are better on idea level rather than as execution. Then again, it's not that serious. Neither is this post.
End result
Life is short
– make stupid animations.
Path from API to R is short
– take advantage of open data.
And an elevator ride is short in the end. To avoid weather talk, use stairs.
∎